Slope Stability Supplement Article by Neil Bar, Gecko Geotechnics LLC, Saint Vincent and the Grenadines

The following is an article from Neil Bar which appeared in the SSIM 2023 Supplement

On the importance of three-dimensional analysis of rock slopes in civil and mining engineering projects

by Neil Bar, Gecko Geotechnics LLC, Saint Vincent and the Grenadines

Introduction

Geotechnical models developed during the planning stages of rock slopes for surface mines and large civil engineering projects are three-dimensional (3D) so as to capture the spatial variation in lithological, structural, hydrogeological, and geomechanical conditions. Geological models that describe the lithological and structural (faulting and folding) characteristics of a deposit or geological setting are almost always 3D. Likewise, boreholes and piezometers used to develop geomechanical properties and groundwater models are drilled at spatial offsets across the deposit to understand the lateral and vertical characteristics. However, when geotechnical stability analysis is completed, often the 3D geological, hydrogeological, and structural models as well as geometrically complex 3D slope designs for optimising overburden removal and, in the case of mines, economic mineral recovery, are simplified to two-dimensional (2D) cross-sections.

Situation

The simplification of 3D conditions to a 2D cross-sectional analysis can lead to the wrong failure mechanism being identified and analysed, a conservative Factor of Safety (FoS) being calculated, and/or an over-estimation of slope stability.
In practice, rock slopes under investigation for civil or mining engineering projects may have one or many of the following conditions for which 3D stability analysis should be included in the geotechnical design review process (McQuillan & Bar 2023):

  • Non-linear slope geometry.
  • Spatially or laterally varying geological (lithology, alteration and weathering) and hydrogeological conditions.
  • Spatially varying material strengths including anisotropic material behaviour in the same unit.
  • Presence of any geological structures such as faults or shears, striking and intersecting up to 50° from the slope orientation.
  • Highly variable 2D results within close spatial proximity to each other.

Figure 1 presents a 3D slope stability model from an open pit mine in Europe which has a north–south striking orebody and cross-cutting intrusions and shear zones (shown in red). That is, the 3D model exhibits slightly non-linear slope geometry, spatially and laterally varying lithology, material strengths and has geological structures. By means of an extruded 2D cross-section and the 3D slope stability model, Figure 1 visually demonstrates the meaning of using a 2D cross-section (and plane strain assumption) to represent 3D geological conditions, and the simplification that results.

Figure 1 – Comparison of three-dimensional (3D) models and their actual representation as two-dimensional (2D) cross-sections. Top: True 3D slope stability model shown in plan view (top left) and isometric view (top right), showing the location of a 2D cross-section used for analysis. Bottom: 2D cross-section (bottom left) and extrusion of the 2D cross-section to visualise its meaning in 3D (bottom right)
Three-dimensional versus two-dimensional example – Cumba slope failure

The Cumba slope failure occurred at Pueblo Viejo gold mine in the Dominican Republic in September 2019. Safety aspects of the failure were managed through the use of a combination prism and radar monitoring with trigger action response protocols.
A detailed investigation was undertaken to understand the failure mechanism, which included aerial photogrammetry, face mapping and a review of available monitoring data (Bar et al. 2022). The failure mechanism was found to be a non-daylighting wedge formed by geological faults shown in Figure 2, which were not identified prior to excavation.

Figure 2 – Cumba slope failure with mapped and modelled faults (Bar et al. 2022)

The Cumba slope failure was back-analysed using 3D limit equilibrium method (LEM) and 3D finite element method (FEM) to improve understanding relating to the shear strength of the geological faults. As shown in Figure 3, the 3D LEM and 3D FEM results were validated spatially with ground-based radar monitoring data.

Figure 3 – Cumba slope failure back-analysis results for partly daylighting wedge. (a) 3D limit equilibrium method (FoS3D = 0.95); (b) 3D finite element method; (c) Model spatial validation using radar displacement data (Bar et al. 2022)

A total of six 2D cross-sections were generated from the 3D model and analysed using 2D LEM, as shown in Figure 4.

Figure 4 – Cumba slope failure back-analysis results for partly daylighting wedge. Top: location of six 2D cross-sections. Bottom: clockwise from top-left showing 2D limit equilibrium method results for cross-sections 1 to 6 with FoS2D ranging from 0.80 to 1.06 (Bar et al. 2022)
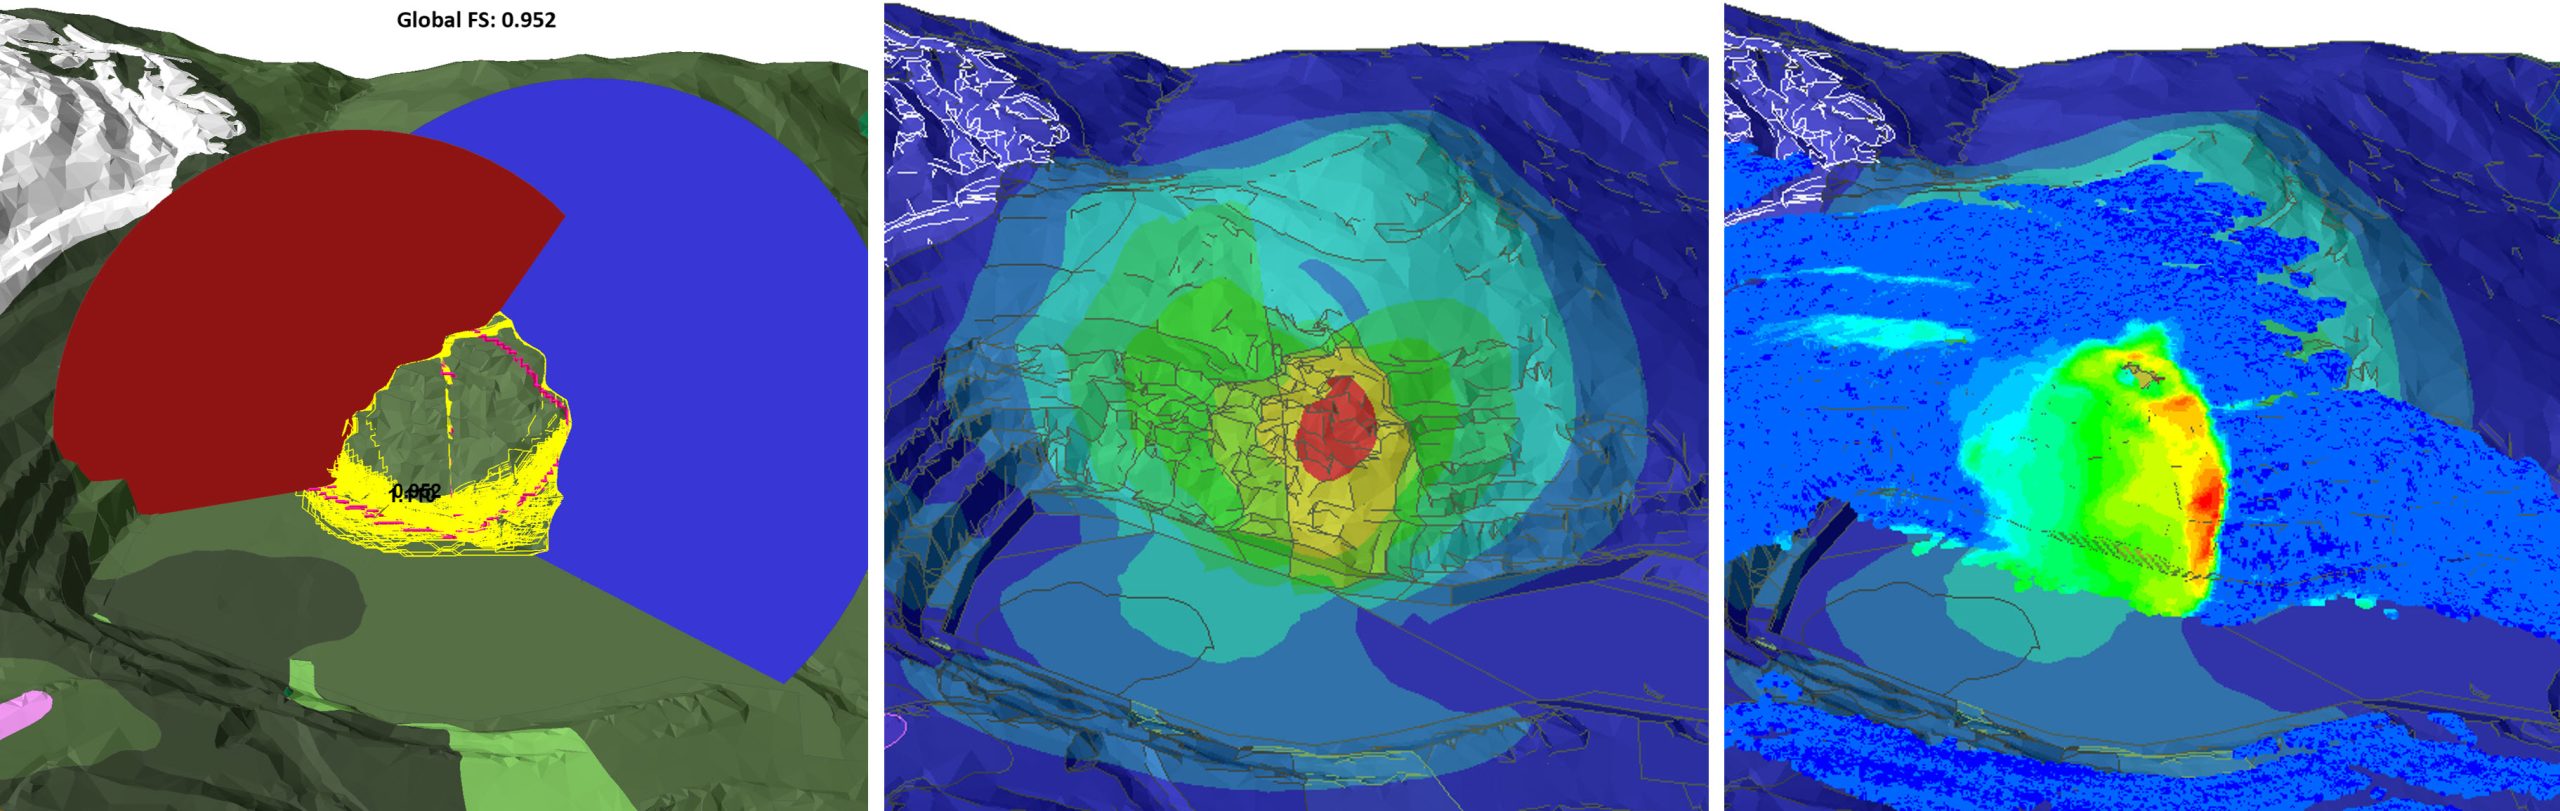
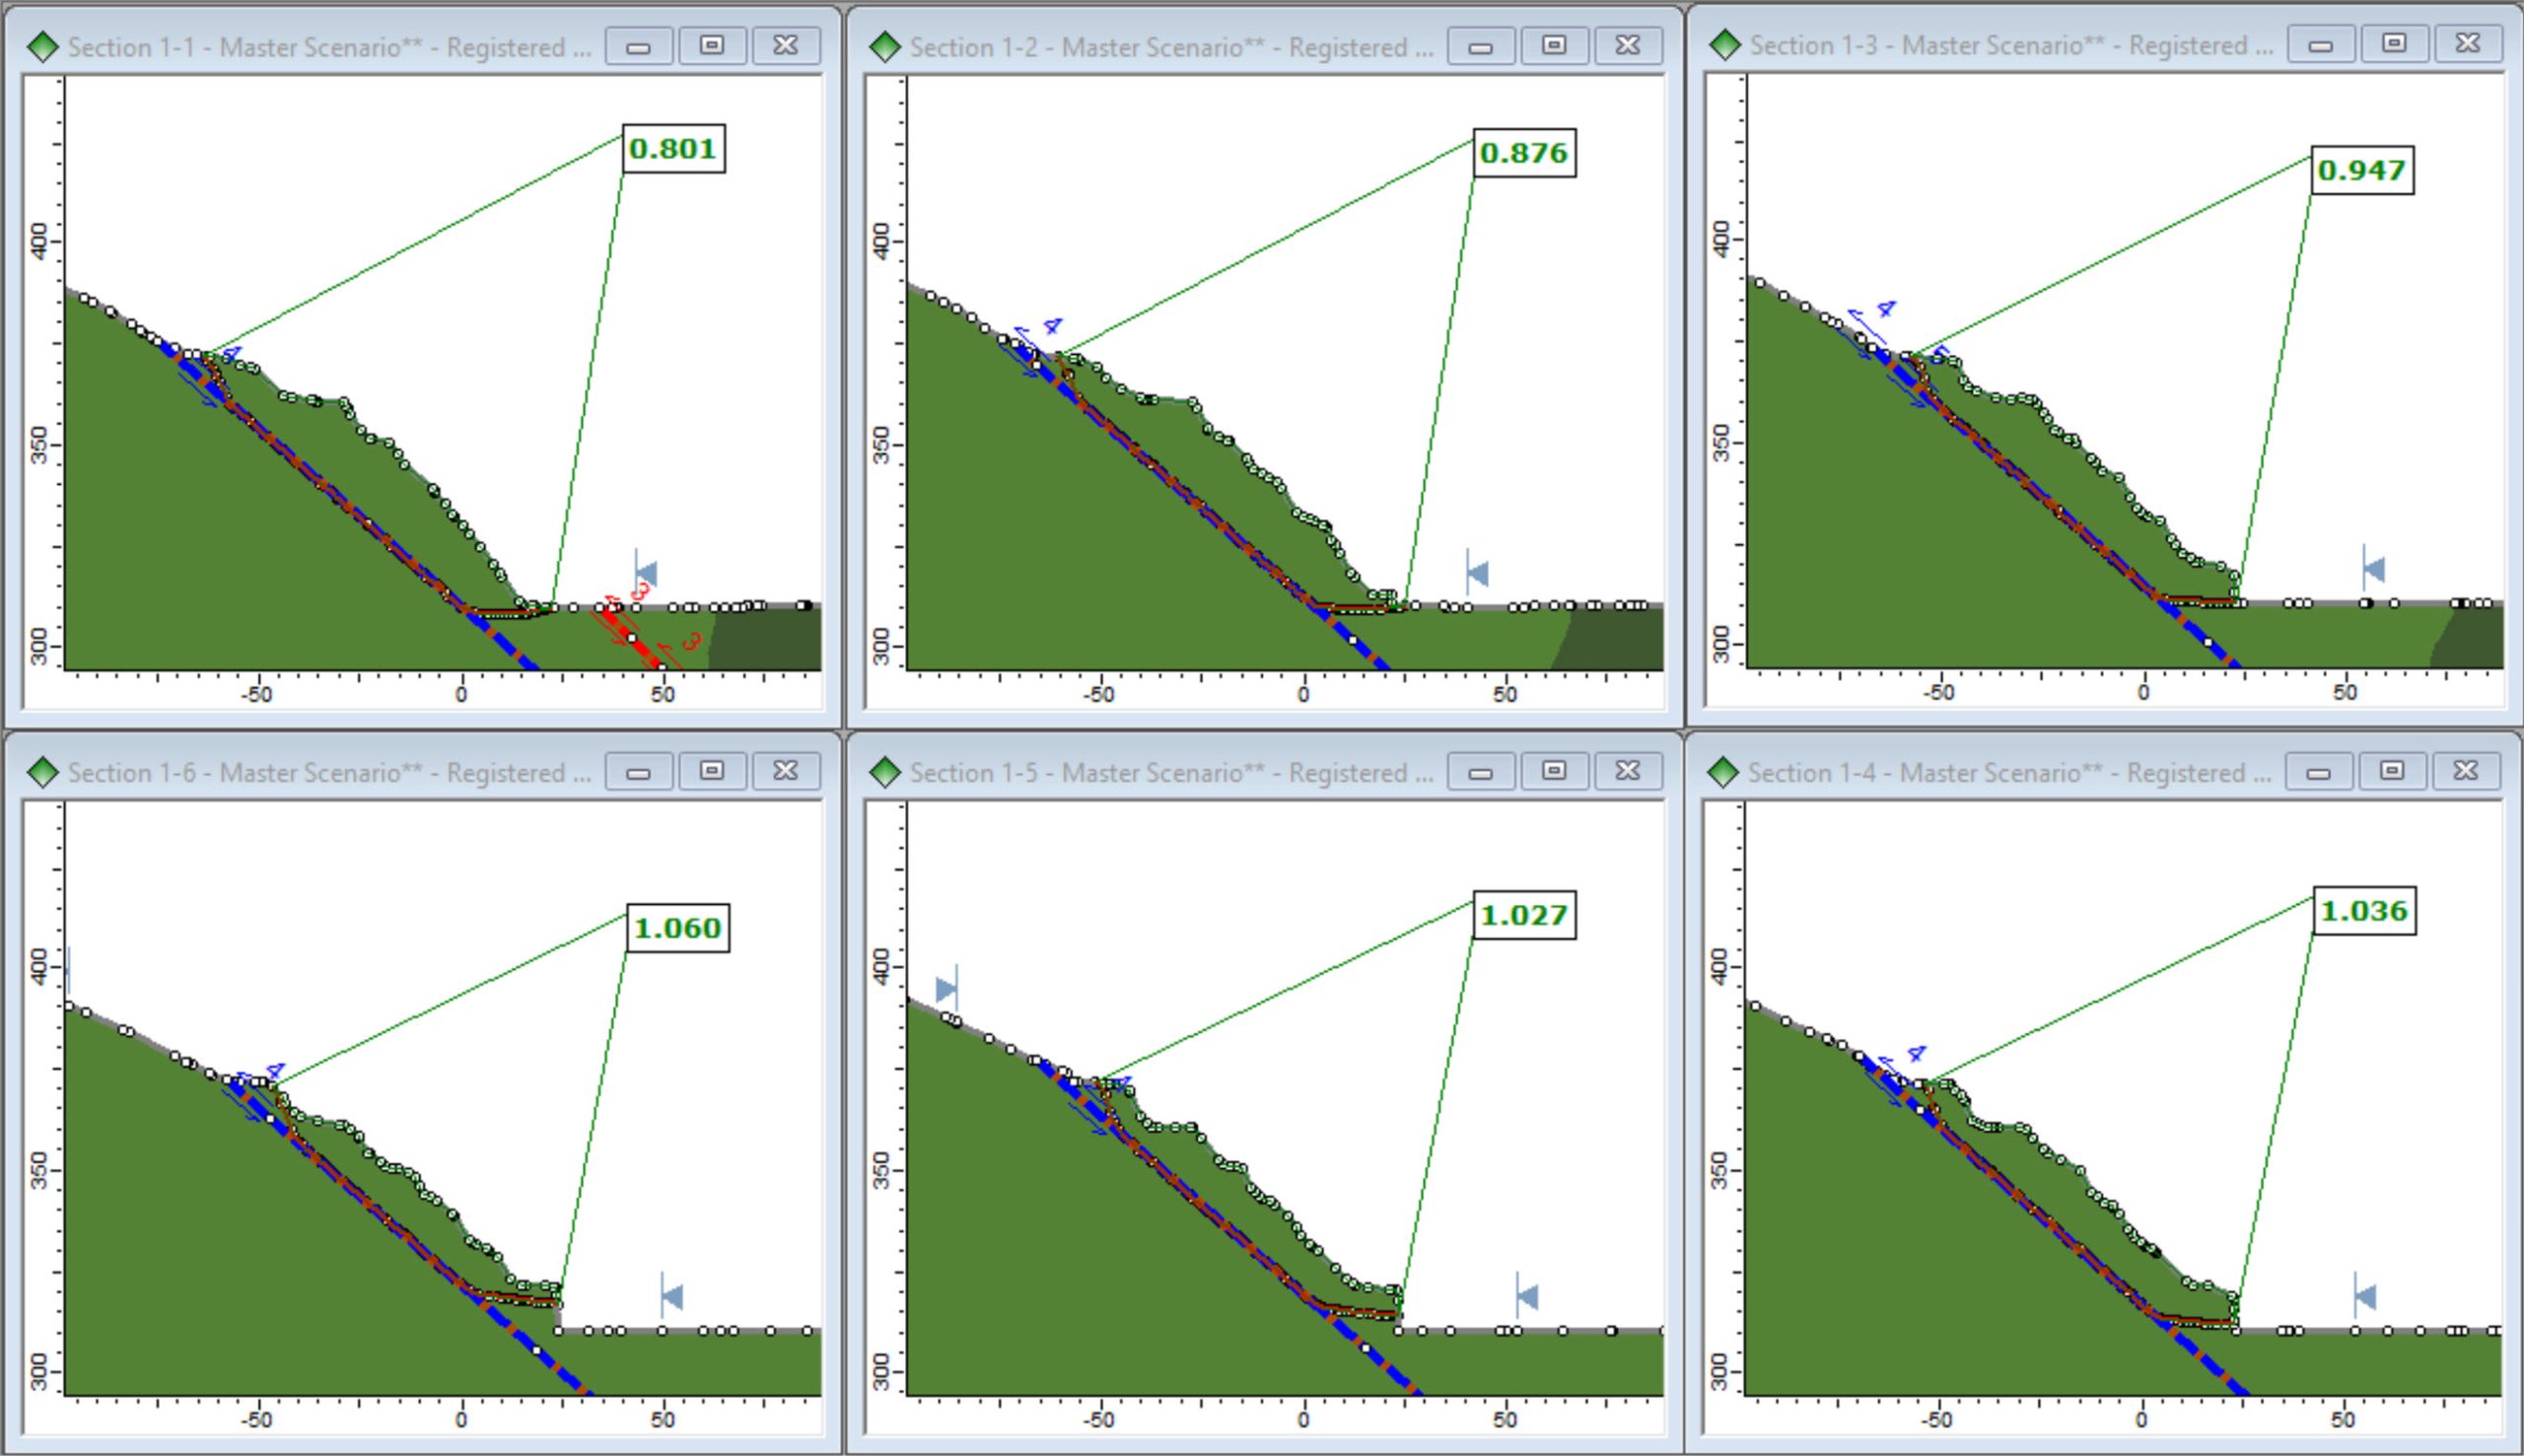
The FoS from the 3D LEM (FoS3D) was 0.95. Similar results were obtained from 3D FEM. For the 2D LEM, FoS2D ranged from 0.80 to 1.06. A comparison of 3D and 2D results shows that FoS2D (from 2D LEM) has between -16% up to +12% variance compared to FoS3D.
Conclusion

The calculation of FoS is engrained in geotechnical design analysis of rock slopes and associated acceptance criteria. To adequately calculate FoS, rock engineers need to representatively model slope geometry, geology, material strength, groundwater conditions and geological structure, all of which inherently vary in 3D.
3D slope stability analysis is the only way to truly represent spatially varying slope geometry, geology, material strengths, and structural and hydrogeological conditions.
Particularly where material strengths are anisotropic or persistent geological structure is present and aligned at angles
acute to the slope orientation, 3D analysis is the only way to sufficiently model slope failure mechanisms which are always 3D in nature. For complex slope geometry and/or geology, 2D analysis and applying plane strain assumptions, are not suitable and fundamentally incorrect. As demonstrated in the example of the Cumba slope failure in which 3D analysis was completed using LEM and FEM to appropriately replicate the failure mechanism, 2D results can both under- or over-estimate FoS by over 10%.

Further reading

Bar, N, Mojica, B, Cobián, JC, Bautista, M, Hammah, R, McQuillan, A, … & Preston, C 2022, ‘Cumba slope failure: a technical review’, Proceedings of Slope Stability 2022, The University of Arizona, School of Mining & Mineral Resources, Tucson.
McQuillan, A & Bar, N 2023, ‘The necessity of 3D analysis for open-pit rock slope stability studies: theory and practice’, Journal of the Southern African Institute of Mining and Metallurgy, vol. 123, no. 2, pp. 63–70.

BAR_Neil

N Bar, Gecko Geotechnics LLC

Leave a Comment

Your email address will not be published. Required fields are marked *