Data Collection: Difference between revisions
No edit summary |
No edit summary |
||
| Line 12: | Line 12: | ||
<imagemap>Image:1. | <imagemap>Image:1.00_Data_Collection.jpg|1000px|center | ||
rect | rect 46 28 311 126 [[Data_Collection|]] | ||
rect | rect 50 137 311 250 [[1._Geological|]] | ||
rect | rect 335 44 723 249 [[2._Mining|]] | ||
rect | rect 754 45 1150 250 [[3._Geotechnical|]] | ||
rect | rect 1177 45 1524 250 [[4._Seismic|]] | ||
desc none | desc none | ||
</imagemap> | </imagemap> | ||
Revision as of 12:04, 9 August 2018
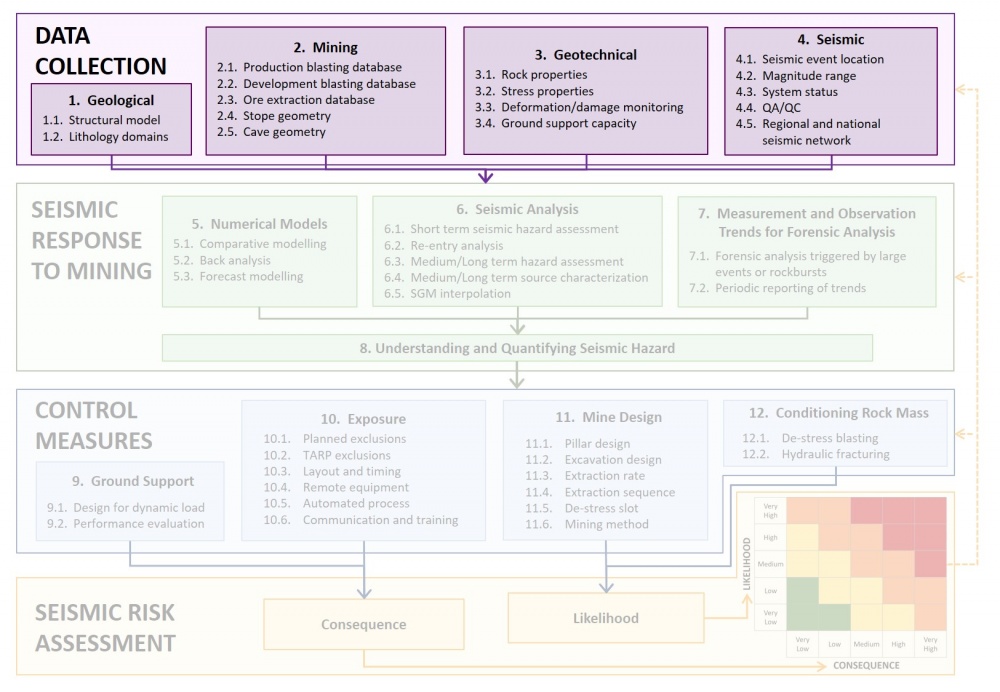
Data Collection
The purple area of activities in the flowchart indicates the critical data required for seismic risk management. With the exception of seismic data, all other data is generally available in some form at most mine sites. The advanced practice in data collection will have a wide range of data, properly organised in databases with good visualisation, facilitating easy access and regular uses in multiple analyses across all databases.
| 1. Geological | 2. Mining | 3. Geotechnical | 4. Seismic |