Data Collection: Difference between revisions
PaulHarris (talk | contribs) No edit summary |
No edit summary |
||
| Line 7: | Line 7: | ||
<div align="center">Click the Data Collection subheadings that you'd like to visit.</div> | <div align="center">Click the Data Collection subheadings that you'd like to visit.</div> | ||
<imagemap>Image: | <imagemap>Image:Slide2.JPG|Subtitle of Image Map Slide2.JPG|center | ||
rect | rect 30 23 200 81 [[https://acg.uwa.edu.au/srmp/Data_Collection|]] | ||
rect | rect 34 88 200 162 [[https://acg.uwa.edu.au/srmp/1._Geological|]] | ||
rect | rect 215 28 462 160 [[https://acg.uwa.edu.au/srmp/2._Mining|]] | ||
rect | rect 483 28 735 159 [[https://acg.uwa.edu.au/srmp/3._Geotechnical|]] | ||
rect | rect 754 28 974 160 [[https://acg.uwa.edu.au/srmp/4._Seismic|]] | ||
</imagemap> | </imagemap> | ||
Revision as of 15:14, 8 June 2020
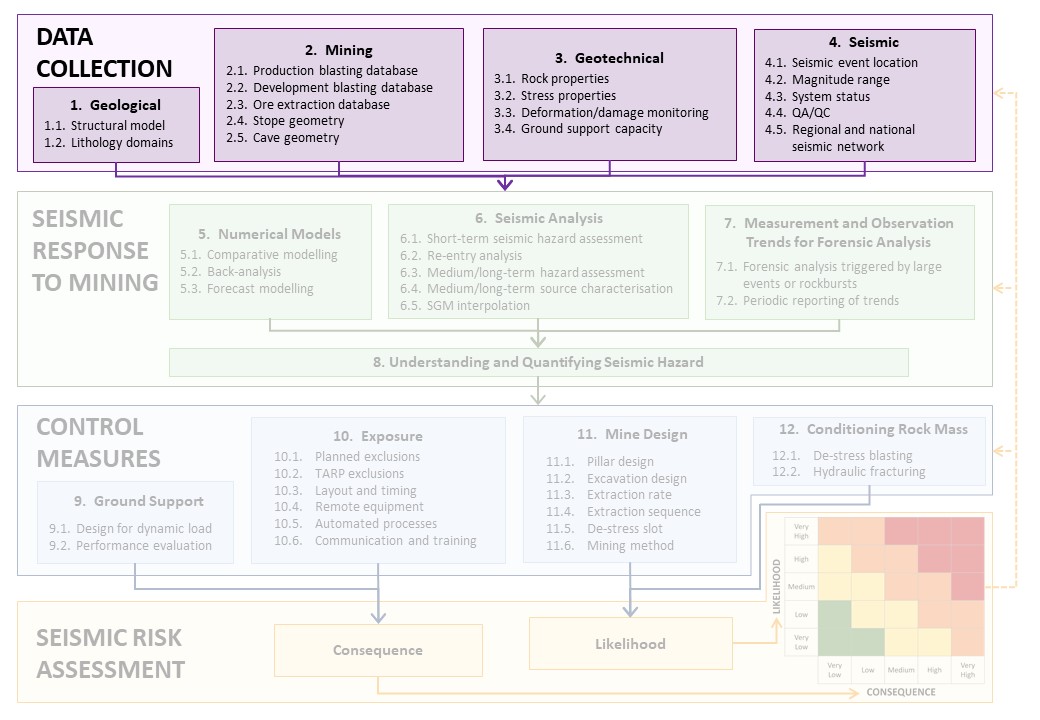
Data Collection
The purple area of activities in the flowchart indicates the critical data required for seismic risk management. With the exception of seismic data, all other data is generally available in some form at most mine sites. The advanced practice in data collection will have a wide range of data, properly organised in databases with good visualisation, facilitating easy access and regular uses in multiple analyses across all databases.
INTERACTIVE FLOWCHART
Click the Data Collection subheadings that you'd like to visit.