4. Seismic: Difference between revisions
No edit summary |
No edit summary |
||
| Line 5: | Line 5: | ||
The recording of seismic events is a complex process. Several steps are required before the waveform data is converted into an event catalogue for further visualisation and interpretation. Figure 14 illustrates the event catalogue ‘production line’; from the wave (1) propagating through the rock mass around excavations (2), picked up by a seismic sensor (3), then recorded (4) and transferred (5) to the seismic server (6). Once recorded on the seismic server, source parameters are calculated with algorithms (7) and manual waveform processing (8). Finally, this results in an event catalogue for further visualisation and analysis (9). Each of these steps allows some room for error and uncertainties. As a result, the seismic network administrator faces numerous challenges when ensuring the quality of seismic data and systematic errors in the recorded seismic data is not uncommon. | The recording of seismic events is a complex process. Several steps are required before the waveform data is converted into an event catalogue for further visualisation and interpretation. Figure 14 illustrates the event catalogue ‘production line’; from the wave (1) propagating through the rock mass around excavations (2), picked up by a seismic sensor (3), then recorded (4) and transferred (5) to the seismic server (6). Once recorded on the seismic server, source parameters are calculated with algorithms (7) and manual waveform processing (8). Finally, this results in an event catalogue for further visualisation and analysis (9). Each of these steps allows some room for error and uncertainties. As a result, the seismic network administrator faces numerous challenges when ensuring the quality of seismic data and systematic errors in the recorded seismic data is not uncommon. | ||
[[File:Figure 14.png]] | |||
Figure 14 Illustration of the steps involved when recording microseismicity in an underground mine (Morkel and Wesseloo 2017b) | Figure 14 Illustration of the steps involved when recording microseismicity in an underground mine (Morkel and Wesseloo 2017b) | ||
| Line 15: | Line 15: | ||
The location of a seismic event is determined by finding its distance from all the seismic sensors used for its processing. The event epicentre is assumed to be a point source where all the distance spheres of the sensors intersect. However, to effectively determine the distance, one requires the P-wave and S-wave velocities for the rock mass. The most common practice to determine the S-wave and P-wave velocities is through calibration blasts. A calibration blast is the firing of a small amount of explosives at a pre-surveyed location. From the relative arrival time of the P-wave and S-wave at each sensor, a velocity distance plot (Figure 15) can be constructed, and the average P-wave and S-wave velocities can be determined. This method works well in a rock mass where there are no excessive voids and there are no large differences in wave velocities between lithologys. | The location of a seismic event is determined by finding its distance from all the seismic sensors used for its processing. The event epicentre is assumed to be a point source where all the distance spheres of the sensors intersect. However, to effectively determine the distance, one requires the P-wave and S-wave velocities for the rock mass. The most common practice to determine the S-wave and P-wave velocities is through calibration blasts. A calibration blast is the firing of a small amount of explosives at a pre-surveyed location. From the relative arrival time of the P-wave and S-wave at each sensor, a velocity distance plot (Figure 15) can be constructed, and the average P-wave and S-wave velocities can be determined. This method works well in a rock mass where there are no excessive voids and there are no large differences in wave velocities between lithologys. | ||
[[File:Figure 15.png]] | |||
Figure 15 Velocity calibration chart for a typical mine (http://www.imseismology.org/velocity-calibration/) | Figure 15 Velocity calibration chart for a typical mine (http://www.imseismology.org/velocity-calibration/) | ||
| Line 21: | Line 21: | ||
Another concept to consider in mine seismology is the installation of seismic sensors in a 3D configuration. This ensures that any mirroring, linear location artefacts and directional bias is limited. In cases where this is not achieved, the location of events in unexpected locations can cause confusion. Figure 16 illustrates the mirroring effect for a mine where smaller events, in the circled area, were being recorded by five closely spaced sensors. This created a mirroring effect and some events were located in an area far away from any mining voids. | Another concept to consider in mine seismology is the installation of seismic sensors in a 3D configuration. This ensures that any mirroring, linear location artefacts and directional bias is limited. In cases where this is not achieved, the location of events in unexpected locations can cause confusion. Figure 16 illustrates the mirroring effect for a mine where smaller events, in the circled area, were being recorded by five closely spaced sensors. This created a mirroring effect and some events were located in an area far away from any mining voids. | ||
[[File:Figure 16.png]] | |||
Figure 16 Event artefacts created by planar seismic systems | Figure 16 Event artefacts created by planar seismic systems | ||
Revision as of 16:00, 11 May 2018
Several seismic parameters are essential in understanding seismic trends; these include event time, event location, event size, and other source parameters. The quality of the data is vital in ensuring the accurate description of seismic trends seen at mines.
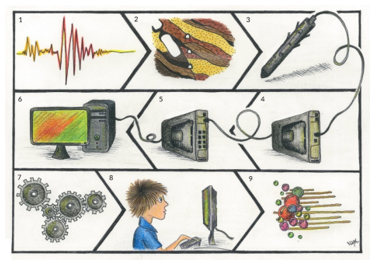
The recording of seismic events is a complex process. Several steps are required before the waveform data is converted into an event catalogue for further visualisation and interpretation. Figure 14 illustrates the event catalogue ‘production line’; from the wave (1) propagating through the rock mass around excavations (2), picked up by a seismic sensor (3), then recorded (4) and transferred (5) to the seismic server (6). Once recorded on the seismic server, source parameters are calculated with algorithms (7) and manual waveform processing (8). Finally, this results in an event catalogue for further visualisation and analysis (9). Each of these steps allows some room for error and uncertainties. As a result, the seismic network administrator faces numerous challenges when ensuring the quality of seismic data and systematic errors in the recorded seismic data is not uncommon.
Figure 14 Illustration of the steps involved when recording microseismicity in an underground mine (Morkel and Wesseloo 2017b)
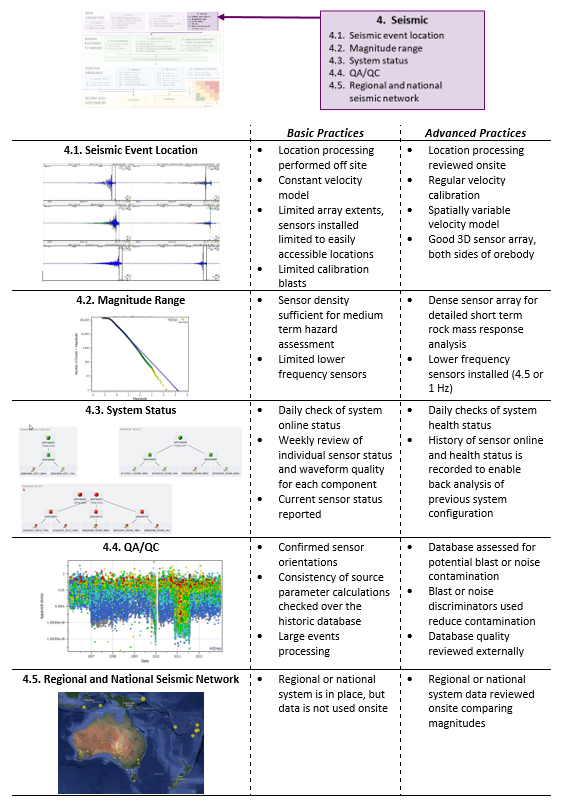
4.1 Seismic Event Location
4.1.1 Seismic event location - basic
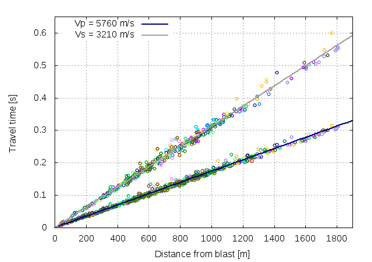
The location of a seismic event is determined by finding its distance from all the seismic sensors used for its processing. The event epicentre is assumed to be a point source where all the distance spheres of the sensors intersect. However, to effectively determine the distance, one requires the P-wave and S-wave velocities for the rock mass. The most common practice to determine the S-wave and P-wave velocities is through calibration blasts. A calibration blast is the firing of a small amount of explosives at a pre-surveyed location. From the relative arrival time of the P-wave and S-wave at each sensor, a velocity distance plot (Figure 15) can be constructed, and the average P-wave and S-wave velocities can be determined. This method works well in a rock mass where there are no excessive voids and there are no large differences in wave velocities between lithologys.
Figure 15 Velocity calibration chart for a typical mine (http://www.imseismology.org/velocity-calibration/)
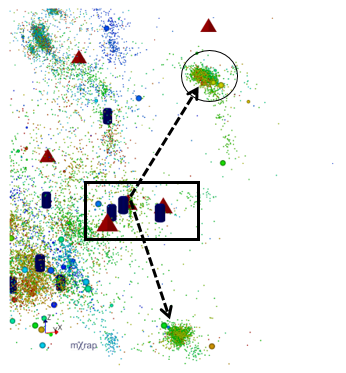
Another concept to consider in mine seismology is the installation of seismic sensors in a 3D configuration. This ensures that any mirroring, linear location artefacts and directional bias is limited. In cases where this is not achieved, the location of events in unexpected locations can cause confusion. Figure 16 illustrates the mirroring effect for a mine where smaller events, in the circled area, were being recorded by five closely spaced sensors. This created a mirroring effect and some events were located in an area far away from any mining voids.
Figure 16 Event artefacts created by planar seismic systems


