
Home: Difference between revisions
No edit summary |
No edit summary |
||
| Line 3: | Line 3: | ||
<imagemap>Image:0.00_SRMP.jpg|1000px|center | <imagemap>Image:0.00_SRMP.jpg|1000px|center | ||
rect | rect 49 32 310 131 [[Data_Collection|]] | ||
rect | rect 52 135 310 251 [[1._Geological|]] | ||
rect 754 44 | rect 336 43 721 250 [[2._Mining|]] | ||
rect 1178 | rect 754 44 1150 251 [[3._Geotechnical|]] | ||
rect | rect 1178 45 1522 252 [[4._Seismic|]] | ||
rect | rect 43 311 244 538 [[Seismic_Response_to_Mining|]] | ||
rect | rect 262 319 580 500 [[5._Numerical_models|]] | ||
rect | rect 607 320 1076 496 [[6._Seismic_analysis|]] | ||
rect | rect 1100 320 1522 499 [[7._Measurement_and_observation_trends_for_forensic_analysis|]] | ||
rect 263 544 1419 587 [[8._Understanding_and_Quantifying_Seismic_Hazard|]] | |||
rect | rect 52 642 366 740 [[Control_Measures|]] | ||
rect | rect 58 753 361 879 [[9._Ground_support|]] | ||
rect 393 650 | rect 393 650 788 877 [[10._Exposure|]] | ||
rect | rect 820 652 1149 876 [[11._Mine_design|]] | ||
rect | rect 1177 651 1540 756 [[12._Conditioning_rock_mass|]] | ||
rect | rect 28 940 1200 1091 [[Seismic_risk_assessment|]] | ||
desc none | desc none | ||
</imagemap> | </imagemap> | ||
<div align="center">This flowchart and all variations of this flowchart are the copyright of the Australian Centre for Geomechanics</div> | <div align="center">This flowchart and all variations of this flowchart are the copyright of the Australian Centre for Geomechanics</div> | ||
Revision as of 17:47, 9 August 2018
INTERACTIVE FLOWCHART
Click the headings and subheadings of the flowchart that you'd like to visit.
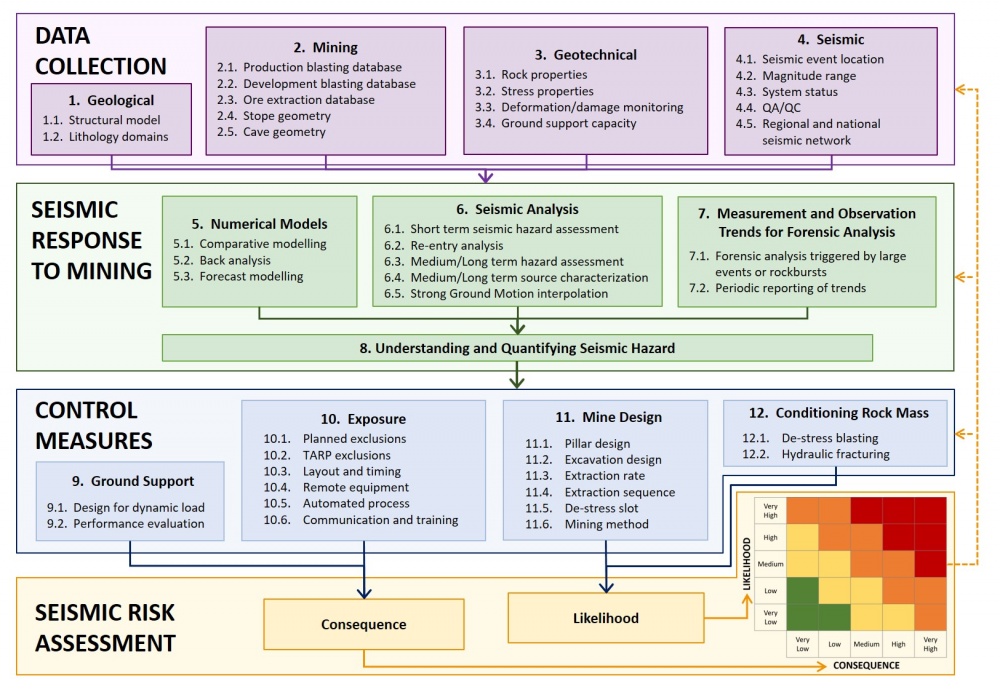
This flowchart and all variations of this flowchart are the copyright of the Australian Centre for Geomechanics
© 2018, Australian Centre for Geomechanics
A Seismic Risk Management Practices flowchart has been developed and verified during the benchmarking exercise. The process has four major activities, each represented by a coloured area in the flowchart:
- Data collection (purple)
- Seismic response to mining (green)
- Control measures (blue)
- Seismic risk assessment (orange)
Within each activity, there are a number of components, represented by boxes in the flowchart. Within each box, a number of practices have been benchmarked and will be discussed in terms of being a “basic” or an “advanced” practice.
Purpose of Project
Seismic risk management in underground hard rock mines is a very important and complex task. With the support of Newcrest Mining Limited (Newcrest), the Australian Centre for Geomechanics (ACG) undertook a survey to obtain a cross-section of the seismic risk management practices used in underground hard rock mines around the world. The survey included contributions from 16 mine sites around the world (participants). The results of this survey were compiled and are made available through this website.
This website provides an overview of what is being done - it is by no means an indication of what should be done.
As our methods and our understanding of mining-induced seismicity improve, so too will our risk management practices. The content of this website will be updated in the future. This is just the start!
Please feel free to send us an email if you wish to contribute content, share ideas, or discuss any errors.