Seismic Response to Mining: Difference between revisions
No edit summary |
No edit summary |
||
| Line 6: | Line 6: | ||
<imagemap>Image:Slide7.JPG|Subtitle of Image Map Slide7.JPG|center | <imagemap>Image:Slide7.JPG|Subtitle of Image Map Slide7.JPG|center | ||
rect | rect 171 198 371 317 [[5._Numerical_Models|]] | ||
rect 389 205 688 317 [[6._Seismic_Analysis|]] | |||
rect 389 | rect 705 205 974 317 [[7._Measurement_and_Observation_Trends_for_Forensic_Analysis|]] | ||
rect | rect 172 351 908 378 [[8._Understanding_and_Quantifying_Seismic_Hazard|]] | ||
rect | |||
</imagemap> | </imagemap> | ||
Revision as of 17:50, 10 June 2020
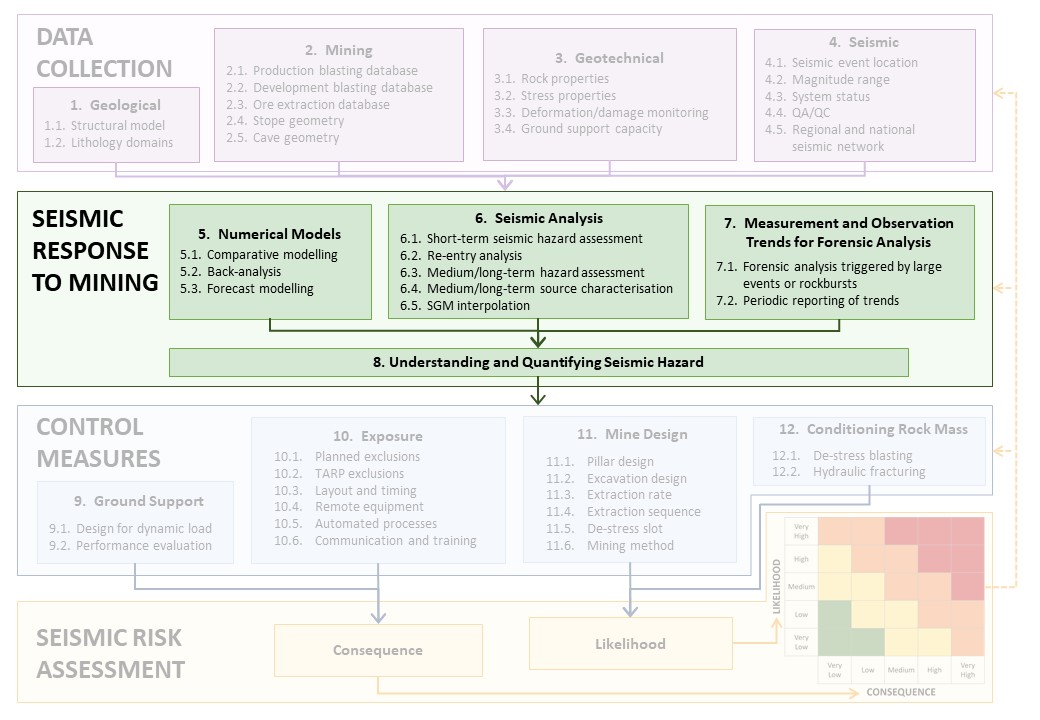
The green area of activities in the flowchart entitled “seismic response to mining” is where the seismic sources in the mine are identified, understood and the seismic hazard is quantified, before control measures are applied to reduce the seismic risk to a tolerable level. The main tools to investigate the seismic response to mining are numerical models, seismological models and case studies of historical seismic response to mining.
INTERACTIVE FLOWCHART
Click the Seismic Response to Mining subheadings that you'd like to visit.