Seismic Response to Mining: Difference between revisions
No edit summary |
No edit summary |
||
| Line 5: | Line 5: | ||
<div align="center">Click the Seismic Response to Mining subheadings that you'd like to visit.</div> | <div align="center">Click the Seismic Response to Mining subheadings that you'd like to visit.</div> | ||
<imagemap>Image: | <imagemap>Image:Slide7.JPG|Subtitle of Image Map Slide7.JPG|center | ||
rect | rect 25 188 163 297 [[https://acg.uwa.edu.au/srmp/Seismic_Response_to_Mining|]] | ||
rect | rect 168 204 369 319 [[https://acg.uwa.edu.au/srmp/5._Numerical_models|]] | ||
rect | rect 389 204 687 317 [[https://acg.uwa.edu.au/srmp/6._Seismic_analysis|]] | ||
rect | rect 706 206 971 318 [[https://acg.uwa.edu.au/srmp/7._Measurement_and_observation_trends_for_forensic_analysis|]] | ||
rect | rect 170 348 907 376 [[https://acg.uwa.edu.au/srmp/8._Understanding_and_Quantifying_Seismic_Hazard|]] | ||
</imagemap> | </imagemap> | ||
Revision as of 15:19, 8 June 2020
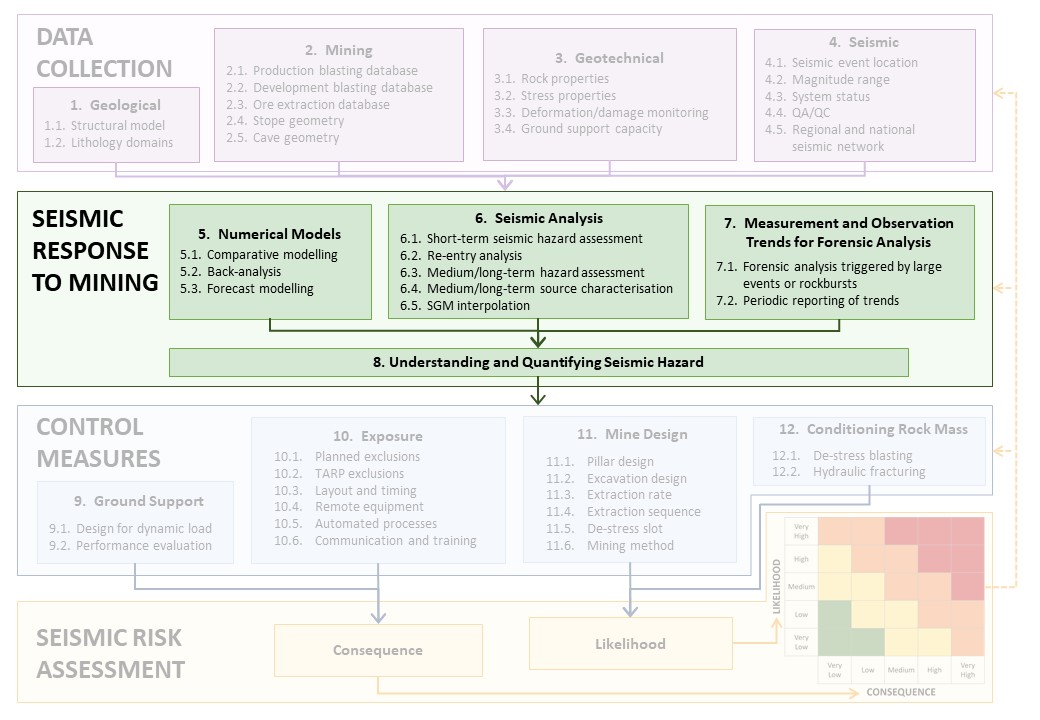
The green area of activities in the flowchart entitled “seismic response to mining” is where the seismic sources in the mine are identified, understood and the seismic hazard is quantified, before control measures are applied to reduce the seismic risk to a tolerable level. The main tools to investigate the seismic response to mining are numerical models, seismological models and case studies of historical seismic response to mining.
INTERACTIVE FLOWCHART
Click the Seismic Response to Mining subheadings that you'd like to visit.