Control Measures: Difference between revisions
No edit summary |
No edit summary |
||
| Line 6: | Line 6: | ||
<imagemap>Image:Slide12.JPG|Subtitle of Image Map Slide12.JPG|center | <imagemap>Image:Slide12.JPG|Subtitle of Image Map Slide12.JPG|center | ||
rect | rect 38 482 234 563 [[9._Ground_support|]] | ||
rect 253 417 504 562 [[10._Exposure|]] | |||
rect 253 | rect 522 416 735 561 [[11._Mine_design|]] | ||
rect | rect 753 416 985 485 [[12._Conditioning_rock_mass|]] | ||
rect | |||
</imagemap> | </imagemap> | ||
Latest revision as of 17:56, 10 June 2020
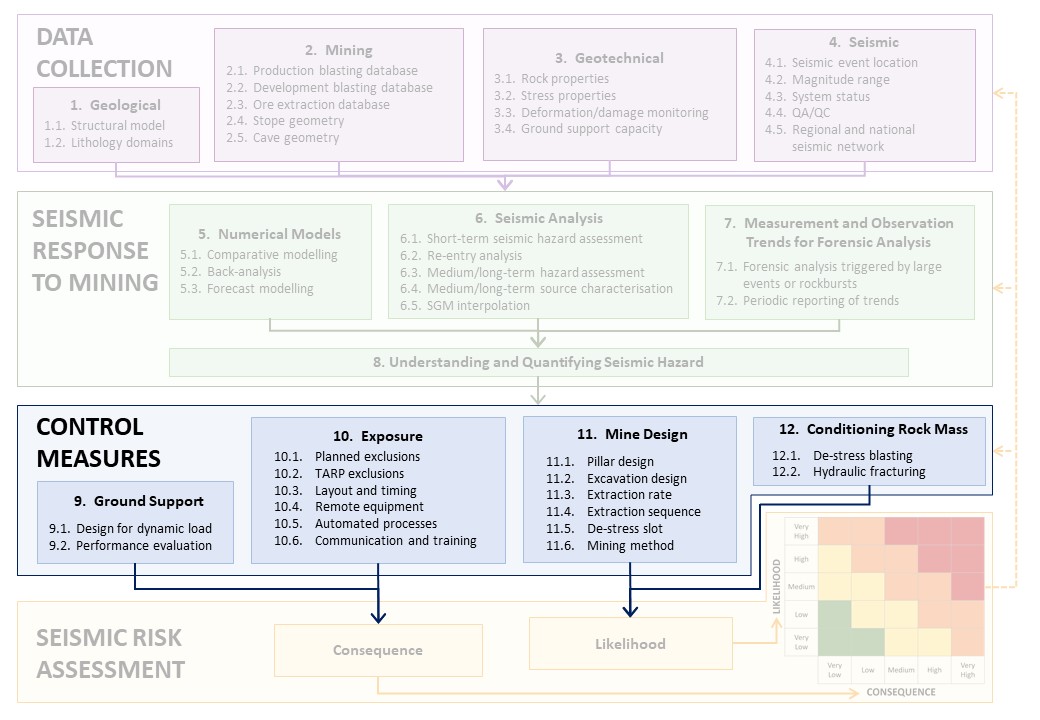
The blue area of activities in the flowchart describes the control measures (see figure below) that can be implemented to mitigate the seismic hazard, as defined in the previous eight steps of the process. Ground support and exposure controls aim at mitigating the consequences of seismic activity. These techniques are employed in all seismically-active mines. Changes in mine design and conditioning the rock mass aim to reduce the seismic hazard. These controls are generally more difficult to apply but, in some cases, can be very efficient in reducing seismic risk.
INTERACTIVE FLOWCHART
Click the Control Measures subheadings that you'd like to visit.