
4. Seismic: Difference between revisions
No edit summary |
|||
| (4 intermediate revisions by the same user not shown) | |||
| Line 1: | Line 1: | ||
__NOTOC__ | __NOTOC__ | ||
[[File:1.04_Seismic.jpg|500px| | [[File:1.04_Seismic.jpg|500px|left|link=]] | ||
<br clear=all> | <br clear=all> | ||
| Line 8: | Line 8: | ||
|- | |- | ||
| | | | ||
|''' | |'''Standard Practices''' | ||
|'''Advanced Properties''' | |'''Advanced Properties''' | ||
|- | |- | ||
| Line 48: | Line 48: | ||
|4.5 Regional and National Seismic Network | |4.5 Regional and National Seismic Network | ||
[[File:Regional.png|150px|link=]] | [[File:Regional.png|150px|link=]] | ||
[https://earthquakes.ga.gov.au/ (Australian Government, Geoscience Australia)] | [https://earthquakes.ga.gov.au/ (Australian Government, Geoscience Australia)] | ||
|<li>Regional or national system is in place, but data is not used onsite</li> | |<li>Regional or national system is in place, but data is not used onsite</li> | ||
| Line 63: | Line 64: | ||
== 4.1 Seismic Event Location == | == 4.1 Seismic Event Location == | ||
=== 4.1.1 | === 4.1.1 Standard === | ||
The location of a seismic event is determined by finding its distance from all the seismic sensors used for its processing. The event epicentre is assumed to be a point source where all the distance spheres of the sensors intersect. However, to effectively determine the distance, one requires the P-wave and S-wave velocities for the rock mass. The most common practice to determine the S-wave and P-wave velocities is through calibration blasts. A calibration blast is the firing of a small amount of explosives at a pre-surveyed location. From the relative arrival time of the P-wave and S-wave at each sensor, a velocity distance plot (as shown in the below figure) can be constructed, and the average P-wave and S-wave velocities can be determined. This method works well in a rock mass where there are no excessive voids and there are no large differences in wave velocities between lithologys. | The location of a seismic event is determined by finding its distance from all the seismic sensors used for its processing. The event epicentre is assumed to be a point source where all the distance spheres of the sensors intersect. However, to effectively determine the distance, one requires the P-wave and S-wave velocities for the rock mass. The most common practice to determine the S-wave and P-wave velocities is through calibration blasts. A calibration blast is the firing of a small amount of explosives at a pre-surveyed location. From the relative arrival time of the P-wave and S-wave at each sensor, a velocity distance plot (as shown in the below figure) can be constructed, and the average P-wave and S-wave velocities can be determined. This method works well in a rock mass where there are no excessive voids and there are no large differences in wave velocities between lithologys. | ||
| Line 98: | Line 99: | ||
== 4.2 Magnitude range == | == 4.2 Magnitude range == | ||
=== 4.2.1 | === 4.2.1 Standard === | ||
System requirements need to consider the magnitude range that needs to be reliably recorded. This includes both the smallest and the largest magnitudes. | System requirements need to consider the magnitude range that needs to be reliably recorded. This includes both the smallest and the largest magnitudes. | ||
| Line 185: | Line 186: | ||
=== 4.2.2 Advanced === | === 4.2.2 Advanced === | ||
Several mines use the method proposed by Wesseloo (2011) for determining the system sensitivity. This is an empirical method determining a correlation between the sensor distances to a location and the achieved sensitivity which is used for forward evaluation. (a) | Several mines use the method proposed by Wesseloo (2011) for determining the system sensitivity. This is an empirical method determining a correlation between the sensor distances to a location and the achieved sensitivity which is used for forward evaluation. Figure (a) below shows an example of such a sensitivity plot for a mine site. | ||
Similar approaches can be performed without using an emperical relationship. In this case the relationship is calculated based on assumed ambient noise level. This method is applied by service providers, not by mine site practitioners themselves. | Similar approaches can be performed without using an emperical relationship. In this case the relationship is calculated based on assumed ambient noise level. This method is applied by service providers, not by mine site practitioners themselves. | ||
Using the online status of the sensors at any given moment, the change in the sensitivity can be assessed as shown in (b) | Using the online status of the sensors at any given moment, the change in the sensitivity can be assessed as shown in Figure (b) below – a plot from IMS ticker. | ||
[[File:Figure 20.png|link=]] | [[File:Figure 20.png|link=]] | ||
| Line 199: | Line 200: | ||
== 4.3 System status == | == 4.3 System status == | ||
=== 4.3.1 | === 4.3.1 Standard === | ||
The maintenance and upkeep of a seismic system is vital in assuring monitoring objectives are reached. A neglected system will lead to inaccurate seismic system values. Most mines perform a daily check on the system online status. This includes the online/offline status of all sensors and sensors experiencing excessive noise problems, as shown in the following figure. These details are recorded and communicated to relevant departments for maintenance. | The maintenance and upkeep of a seismic system is vital in assuring monitoring objectives are reached. A neglected system will lead to inaccurate seismic system values. Most mines perform a daily check on the system online status. This includes the online/offline status of all sensors and sensors experiencing excessive noise problems, as shown in the following figure. These details are recorded and communicated to relevant departments for maintenance. | ||
| Line 213: | Line 214: | ||
== 4.4 QA/QC == | == 4.4 QA/QC == | ||
=== 4.4.1 | === 4.4.1 Standard === | ||
The recording of data can easily be affected by systematic errors for all data acquisition systems. It is vital that several quality assurance and quality control measures are in place. | The recording of data can easily be affected by systematic errors for all data acquisition systems. It is vital that several quality assurance and quality control measures are in place. | ||
| Line 247: | Line 248: | ||
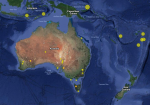
Figure: Result from the Australian national seismic network [http://www.ga.gov.au/interactive-maps/#/theme/hazards/map/earthquakehazards (Australian Government, Geoscience Australia)] | Figure: Result from the Australian national seismic network [http://www.ga.gov.au/interactive-maps/#/theme/hazards/map/earthquakehazards (Australian Government, Geoscience Australia)] | ||
=== 4.5.1 | === 4.5.1 Standard === | ||
Standard practice includes the correlation between magnitude values provided by the local and regional/national networks and the adjustment of values where applicable. | |||
=== 4.5.2 Advanced === | === 4.5.2 Advanced === | ||
Advanced practice includes the importing of waveforms recorded by regional and national sensors to improve source parameter calculations, when these are available. | Advanced practice includes the importing of waveforms recorded by regional and national sensors to improve source parameter calculations, when these are available. | ||
Latest revision as of 14:20, 8 June 2020
| Standard Practices | Advanced Properties | |
| 4.1 Seismic Event Location
|
||
| 4.2 Magnitute Range
|
||
| 4.3 System Status
|
||
| 4.4 QA/QC
|
||
| 4.5 Regional and National Seismic Network
|
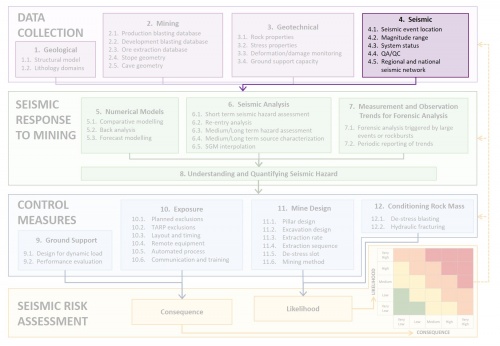
Several seismic parameters are essential in understanding seismic trends; these include event time, event location, event size, and other source parameters. The quality of the data is vital in ensuring the accurate description of seismic trends seen at mines.
The recording of seismic events is a complex process. Several steps are required before the waveform data is converted into an event catalogue for further visualisation and interpretation. The figure below illustrates the event catalogue ‘production line’; from the wave (1) propagating through the rock mass around excavations (2), picked up by a seismic sensor (3), then recorded (4) and transferred (5) to the seismic server (6). Once recorded on the seismic server, source parameters are calculated with algorithms (7) and manual waveform processing (8). Finally, this results in an event catalogue for further visualisation and analysis (9). Each of these steps allows some room for error and uncertainties. As a result, the seismic network administrator faces numerous challenges when ensuring the quality of seismic data and systematic errors in the recorded seismic data is not uncommon.
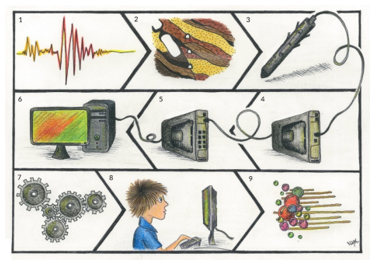
Figure: Illustration of the steps involved when recording microseismicity in an underground mine (Morkel and Wesseloo 2017b)
4.1 Seismic Event Location
4.1.1 Standard
The location of a seismic event is determined by finding its distance from all the seismic sensors used for its processing. The event epicentre is assumed to be a point source where all the distance spheres of the sensors intersect. However, to effectively determine the distance, one requires the P-wave and S-wave velocities for the rock mass. The most common practice to determine the S-wave and P-wave velocities is through calibration blasts. A calibration blast is the firing of a small amount of explosives at a pre-surveyed location. From the relative arrival time of the P-wave and S-wave at each sensor, a velocity distance plot (as shown in the below figure) can be constructed, and the average P-wave and S-wave velocities can be determined. This method works well in a rock mass where there are no excessive voids and there are no large differences in wave velocities between lithologys.
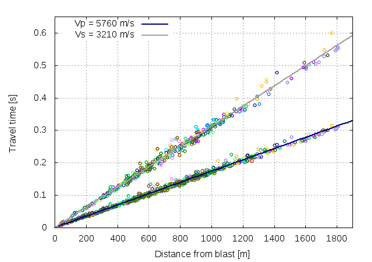
Figure: Velocity calibration chart for a typical mine (Institute of Mine Seismology)
Another concept to consider in mine seismology is the installation of seismic sensors in a 3D configuration. This ensures that any mirroring, linear location artefacts and directional bias is limited. In cases where this is not achieved, the location of events in unexpected locations can cause confusion. The following figure illustrates the mirroring effect for a mine where smaller events, in the circled area, were being recorded by five closely spaced sensors. This created a mirroring effect and some events were located in an area far away from any mining voids.
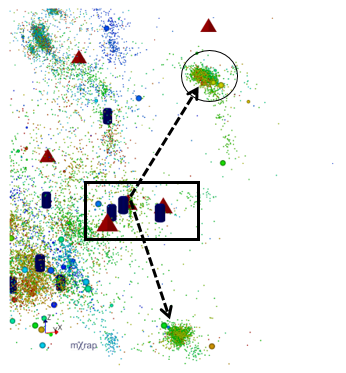
Figure: Event artefacts created by planar seismic systems
4.1.2 Advanced
More sophisticated location algorithms are applied at some sites. The need for this extra sophistication is determined by the complexity of the rock mass. In some South African mines, for example, the orebody is surrounded by a lava hanging wall and a shale footwall. A large contrast in stiffness exists between these lithological units. The wave front propagates faster through the lava layer and creates head waves which leads to systematic errors in the event locations. A two-layered velocity model will improve the location accuracy in such circumstances.
For a more complex rock mass with large 3D spatial variations in velocity and large voids, the use of ray tracing is more appropriate. Ray tracing relies on describing the rock mass with a velocity model. Seismic waves cannot travel through voids and travel slower through fractured zones. This causes the ray-paths to bend. The below figure shows how the ray paths of a seismic event will change if a low velocity barrier is located between the sensors and the event. This method is not standard practice at all mines, but is becoming more common where it is required due to rock mass complexity.
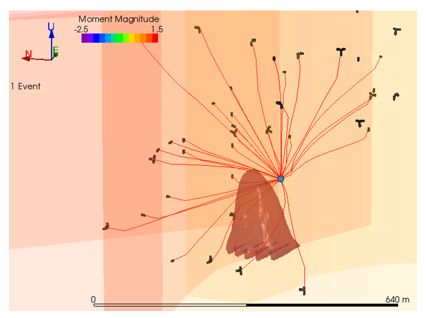
Figure: Illustration of ray path being disturbed by heterogeneous velocities and voids (Collins et al. 2014)
More recently, automated statistical methods are becoming a possibility. Martinsson (2013) proposes a probabilistic method (Bayesian) for determining the hypocentre location of events, when the phase arrival times of seismic waves are poor, inconsistent or insufficient. The use of such methods allows the processing of large amounts of seismic data at low costs, as human interaction is at a minimum. This method was developed by LKAB and is implemented on two of their sites.
Meyer and de Wit (2016) suggested the use of a ‘brightness’ location method in caving mines, as shown in the below figure, where signal traces may not contain easily identifiable P- and S-wave traces. This method involves estimating the origin of seismic waves based on travel times of envelopes of seismic energy. The use of such methods allows the processing of large amounts of seismic data at low costs, as human interaction is at a minimum.
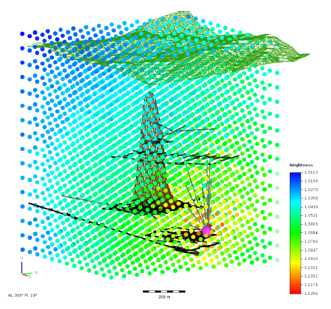
Figure: Brightness values at each grid point for an example seismic event. The location of the event calculated using contentional processing is shown as the large pink sphere (Meyer and de Wit 2016)
4.2 Magnitude range
4.2.1 Standard
System requirements need to consider the magnitude range that needs to be reliably recorded. This includes both the smallest and the largest magnitudes.
On the small end of the scale the system sensitivity (magnitude of completeness, mmin) is required. The mmin is the smallest magnitude above which all events within a certain area are reliably recorded. The table below provides suggested minimum system sensitivity for different requirements. Many mines aim to achieve the first class (or even ML -2) for at least the largest part of the mine, since this is seldom achieved throughout the mine.
| # | Application | System resolution (MR min) | Mode | Mining area |
| 1 | Rock mass monitoring | -1.5 | HIGH_RISK: Investigate rockmass response in detail (short term) | All active zones of inherent high seismic risk should be covered |
| 2 | Hazard assessment | -1.0 | HAZARD: Reliable Seismic Hazard Scale assessment, seismic hazard mapping (medium term) | All zones of active mining should be covered |
| 3 | Damage location | -0.5 | REACTIVE: Locating areas of possible damage after a significant or large seismic event has occurred (real time response) | All zones of active and abandoned mining should be covered |
Table: Minimum required magnitude ranges based on monitoring objectives
The table below (Jager and Ryder 1999) gives the recommended location accuracy for different network sensitivities associated with different objectives of monitoring, with approximate source sizes quoted for reference.
| Objective of monitoring | Location | Prevention | Control | Warnings | |||
| Network sensitivity (mmin) | 1.0 | 0.5 | 0.0 | -0.5 | -1.0 | -1.5 | -2.0 |
| Desired minimum location accuracy (m) | 100 | 75 | 40 | 20 | 15 | 10 | 5 |
| Approximate source sizes (m) at stress drops between 0.1 and 0.5 MPa | 65–110 | 35–65 | 20–35 | 12–20 | 6–12 | 4–6 | 2–4 |
Table 3 Recommended location accuracy and mmin to achieve specific monitoring objectives (Jager and Ryder 1999)
One of the most common approaches to achieving adequate system sensitivity is to aim for a low enough sensor density or inter-sensor spacing. This approach often provides a first pass input to system design, as shown in the following figure. This is supplemented by a simple check of the distance to the fifth sensor.
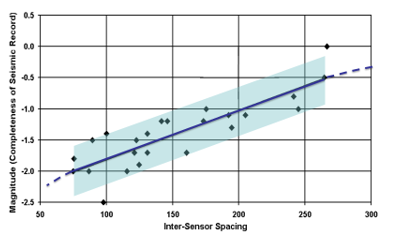
Figure: Plot of inter-sensor spacing and mmin achieved at different mine sites (Hudyma and Brummer 2007)
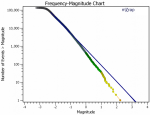
Recent work by Morkel and Wesseloo (2017a) shows that the under-recording of event magnitudes is a problem in mining. Depending on the rock mass and stress conditions, most mines are not able to accurately capture events with ML>2. It is these events that have the largest impact on the determination of the seismic hazard state. Furthermore, these large events tend to be the most likely to cause damage, and therefore inaccurate magnitude values could lead to the under- or over-design of ground support.
Historically, the system designs have not given due consideration to installing enough and sufficiently low frequency sensors, with many sites not including sensors with a frequency range below 14 Hz.
4.2.2 Advanced
Several mines use the method proposed by Wesseloo (2011) for determining the system sensitivity. This is an empirical method determining a correlation between the sensor distances to a location and the achieved sensitivity which is used for forward evaluation. Figure (a) below shows an example of such a sensitivity plot for a mine site.
Similar approaches can be performed without using an emperical relationship. In this case the relationship is calculated based on assumed ambient noise level. This method is applied by service providers, not by mine site practitioners themselves.
Using the online status of the sensors at any given moment, the change in the sensitivity can be assessed as shown in Figure (b) below – a plot from IMS ticker.
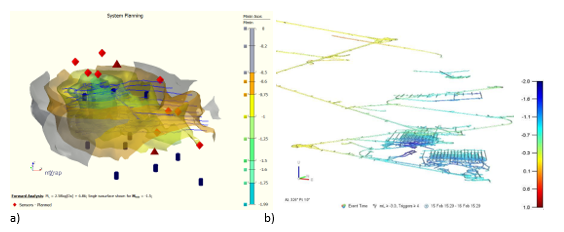
Figure: Plots of seismic system sensitivity (Mmin) a) design plots in mXrap; b) real time evaluation based on current online sensors in IMS ticker
For the reliable recording of large events, some sites are installing lower frequency sensors (often 4.5 Hz) with some sites considering to include 1 Hz. Malmberget mine has a surface system, separate from the underground system, consisting of 1 Hz sensors. Integration of the 1 Hz sensors into the underground system has not been performed.
4.3 System status
4.3.1 Standard
The maintenance and upkeep of a seismic system is vital in assuring monitoring objectives are reached. A neglected system will lead to inaccurate seismic system values. Most mines perform a daily check on the system online status. This includes the online/offline status of all sensors and sensors experiencing excessive noise problems, as shown in the following figure. These details are recorded and communicated to relevant departments for maintenance.
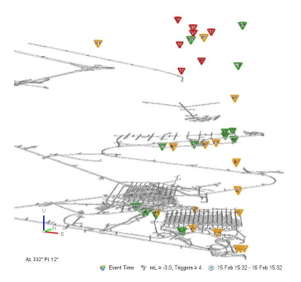
Figure: IMS Ticker plot of sensor online status of sensors (Red = offline, orange = no recent triggers, green = online)
4.3.2 Advanced
For mine sites which are heavily reliant on the description and analysis of seismic events, an accurate historical system status is critical. Such a database is required to ensure that any back analysis trends are real and not artificially induced by changes in the seismic system configuration. Keeping a reliable log of the installation and decomissioning data of different sensors and longer periods of downtime of different system components (for example, a GS box and attached sensors) is seldom done. More indepth audits into the system and sensor performance are seldom performed. Such audits will highlight system problems not detected by automated system status reports.
4.4 QA/QC
4.4.1 Standard
The recording of data can easily be affected by systematic errors for all data acquisition systems. It is vital that several quality assurance and quality control measures are in place.
Blast and orepass noise contamination is a common problem in the industry. Manually tagging blast-events as such during manual processing is common practice. The effectiveness of this approach varies with the percentage of blasts contaminating the database varying from site to site. Removal of orepass noise is generally not done and is generally accounted for by making allowance for anomalies around orepasses due to the effect of the noise. At some sites, other noise (like that of rock breakers) is manually tagged and removed from the database.
QA/QC on system components are generally performed as the system is commissioned. This includes the confirmation of sensor orientation since correctly installed orientation is important for reliable moment tensor inversions.
It is not common for most mine sites to have a consistent database with high quality seismic data. In most cases manual processing of events is outsourced. The processing is then performed by non-technical seismic processors not familiar with the site. In spite of this, regular auditing of the manual processing is not often performed.
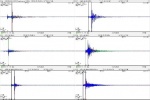
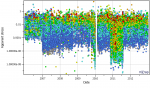
Morkel and Wesseloo (2017b) showed widespread data problems in the industry with respect to the internal consistency of seismic databases, with many databases showing abrupt changes in source parameters, as shown in the figure below. Checks on the internal database consistency are not routinely performed, although checks are now becoming more common.
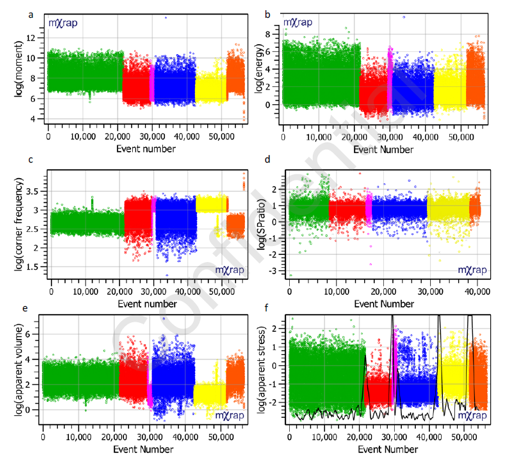
Figure: Example of systematic shifts in seismic data (Morkel and Wesseloo 2017b)
4.4.2 Advanced
Some QA/QC is performed by removal of obvious outliers in terms of the database’s source parameters. Some blast discrimination techniques exist and some sites are implementing these to automatically remove such blasts from the database. Similar methods for removal of orepass noise are being trialed, but do not appear to be effective.
Independent external auditing of the seismic system and data quality is not common, but has been done at some mines.
4.5. Regional and national seismic network
The larger mining-induced seismic events are often recorded by regional (first figure below) and national (second figure below) seismic networks and, when available, the largest of the larger mining-induced events are also recorded and catalogued by National Geological Survey orgasations such as USGS or AGSO. The local databases often overlap with regional network databases and, to a lesser extent, with national networks. Although locations of the regional and national networks are not accurate on a local scale, they generally provide good source parameters.
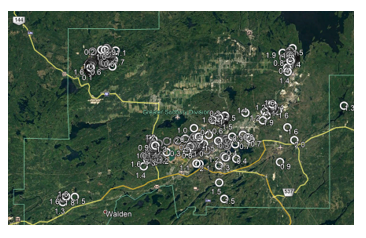
Figure: Events recorded by the Sudbury Regional Seismic Network for October to December 2017 (Government of Canada, Natural Resources Canada)
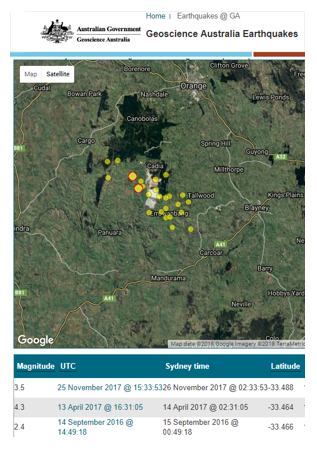
Figure: Result from the Australian national seismic network (Australian Government, Geoscience Australia)
4.5.1 Standard
Standard practice includes the correlation between magnitude values provided by the local and regional/national networks and the adjustment of values where applicable.
4.5.2 Advanced
Advanced practice includes the importing of waveforms recorded by regional and national sensors to improve source parameter calculations, when these are available.