
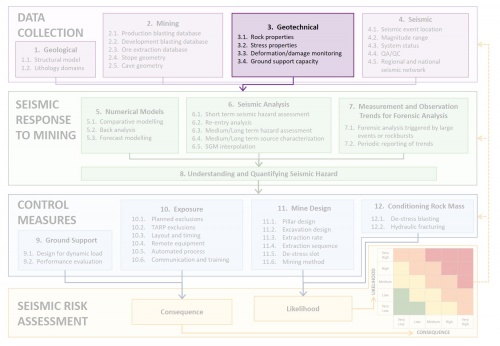
3. Geotechnical: Difference between revisions
| (9 intermediate revisions by the same user not shown) | |||
| Line 1: | Line 1: | ||
__NOTOC__ | |||
[[File: | [[File:1.03_Geotechnical.jpg|500px|left|link=]] | ||
<br clear=all> | |||
{| class="wikitable" | {| class="wikitable" | ||
|- | |- | ||
| | | | ||
| | |Standard Practices | ||
|Advanced Properties | |Advanced Properties | ||
|- | |- | ||
|3.1 Rock Properties | |3.1 Rock Properties | ||
[[File:Rock Properties. | [[File:Rock Properties-01.png|150px|link=]] | ||
[https://www.usask.ca/ (University of Saskatchewan)] | |||
|<li>UCS and elastic properties</li> | |<li>UCS and elastic properties</li> | ||
<li>Majority of testing in feasibility</li> | <li>Majority of testing in feasibility</li> | ||
| Line 19: | Line 22: | ||
|- | |- | ||
|3.2 Stress Properties | |3.2 Stress Properties | ||
[[File: | [[File:Stress_Properties.png|150px|link=]] | ||
|<li>Overcoring and/or core testing during feasibility and mine construction</li> | |<li>Overcoring and/or core testing during feasibility and mine construction</li> | ||
<li>Limited test samples</li> | <li>Limited test samples</li> | ||
| Line 29: | Line 32: | ||
|- | |- | ||
|3.3 Deformation/Damage Monitoring | |3.3 Deformation/Damage Monitoring | ||
[[File:Deformation Damage Monitoring.png| | [[File:Deformation Damage Monitoring.png|150px|link=]] | ||
(Kaiser 1996) | |||
|<li>Regular inspections but only sparsely documented</li> | |<li>Regular inspections but only sparsely documented</li> | ||
<li>Individual damage incidents investigated and reported</li> | <li>Individual damage incidents investigated and reported</li> | ||
| Line 40: | Line 44: | ||
|- | |- | ||
|3.4 Ground Support Capacity | |3.4 Ground Support Capacity | ||
[[File:Ground Support Capacity.jpg| | [[File:Ground Support Capacity.jpg|150px|link=]] | ||
(Cai and Kaiser 2018) | |||
|<li>Records kept for planned ground support</li> | |<li>Records kept for planned ground support</li> | ||
<li>Support condition visually checked over time</li> | <li>Support condition visually checked over time</li> | ||
| Line 54: | Line 59: | ||
== 3.1 Rock properties == | == 3.1 Rock properties == | ||
=== 3.1.1 | === 3.1.1 Standard === | ||
Standard geomechanical properties of intact rock (Uniaxial Compressive Strength (UCS), density (ρ), Young’s modulus (E), Poisson’s ratio (ν)) are generally defined for each geotechnical rock type. Field measurements such as point load tests are often used to supplement laboratory testing. Rock testing is often done during feasibility studies, but additional testing is not conducted regularly during production. | |||
Core logging is normally done using various rock mass classification systems. Borehole mapping using televiewer and underground mapping is often used to supplement core logging data, as shown in the below figure. Rock mass classification systems are generally used to quantify the reduction in strength between the intact rock and the rock mass. The rock mass properties, as an equivalent continuum, are generally used in mine scale numerical modelling assessments. Rock mass quality block models are normally done with the geological modelling software used on site. This sometimes means the format is difficult to export into seismic analysis software which inhibits the assessment of the variation in seismic hazard as a function of rock mass quality. | Core logging is normally done using various rock mass classification systems. Borehole mapping using televiewer and underground mapping is often used to supplement core logging data, as shown in the below figure. Rock mass classification systems are generally used to quantify the reduction in strength between the intact rock and the rock mass. The rock mass properties, as an equivalent continuum, are generally used in mine scale numerical modelling assessments. Rock mass quality block models are normally done with the geological modelling software used on site. This sometimes means the format is difficult to export into seismic analysis software which inhibits the assessment of the variation in seismic hazard as a function of rock mass quality. | ||
[[File:Figure 9.png]] | [[File:Figure 9.png|link=]] | ||
Figure: Geotechnical logging of drill core | Figure: Geotechnical logging of drill core [http://bit.ly/2CMGa2F (Institution of Civil Engineers)] | ||
=== 3.1.2 Advanced === | === 3.1.2 Advanced === | ||
| Line 75: | Line 79: | ||
== 3.2 Stress properties == | == 3.2 Stress properties == | ||
=== 3.2.1 | === 3.2.1 Standard === | ||
Pre-mining stresses are assessed during the feasibility or early operating stages of most projects. In mining, the most common stress measurement techniques include overcoring using the Hollow Inclusion (HI) cell, or by core testing under uniaxial load in the laboratory using acoustic emission (AE) activity and deformation rate analysis (DRA). These approaches can be used to estimate the full in situ stress field. | Pre-mining stresses are assessed during the feasibility or early operating stages of most projects. In mining, the most common stress measurement techniques include overcoring using the Hollow Inclusion (HI) cell, or by core testing under uniaxial load in the laboratory using acoustic emission (AE) activity and deformation rate analysis (DRA). These approaches can be used to estimate the full in situ stress field. | ||
| Line 89: | Line 93: | ||
Some operations also employ real-time stress monitoring in selected areas such as regional pillars, critical infrastructure and cave footprints. Monitoring boreholes are also used to assess stress conditions over time. Borehole cameras are used to monitor the signs of high stress conditions along the borehole as mining progresses, as shown in the figure below. Large rock mass deformation, plate bending and rock mass deterioration are all signs of high stress conditions in a drive. Regular field observations are recorded to infer the stress level at the surface of new developments. Acoustic televiewers are used to interpret the local stress from breakouts. | Some operations also employ real-time stress monitoring in selected areas such as regional pillars, critical infrastructure and cave footprints. Monitoring boreholes are also used to assess stress conditions over time. Borehole cameras are used to monitor the signs of high stress conditions along the borehole as mining progresses, as shown in the figure below. Large rock mass deformation, plate bending and rock mass deterioration are all signs of high stress conditions in a drive. Regular field observations are recorded to infer the stress level at the surface of new developments. Acoustic televiewers are used to interpret the local stress from breakouts. | ||
[[File:Figure 10.png]] | [[File:Figure 10.png|link=]] | ||
Figure: Borehole breakout can be monitored with borehole camera and acoustic televiewer logging (Goodfellow et al. 2017) | Figure: Borehole breakout can be monitored with borehole camera and acoustic televiewer logging (Goodfellow et al. 2017) | ||
| Line 95: | Line 99: | ||
== 3.3 Deformation/damage monitoring == | == 3.3 Deformation/damage monitoring == | ||
=== 3.3.1 | === 3.3.1 Standard === | ||
Rock mass deformation is normally monitored during regular inspections, but often the observations are only sparsely documented and not collated into a searchable format. Incidents of damage are generally reported individually and there is no easily accessible database to facilitate long term analysis of damage trends across many incidents. | Rock mass deformation is normally monitored during regular inspections, but often the observations are only sparsely documented and not collated into a searchable format. Incidents of damage are generally reported individually and there is no easily accessible database to facilitate long term analysis of damage trends across many incidents. | ||
| Line 107: | Line 111: | ||
Detailed damage observations are made regularly, sometimes using electronic tablets, in addition to significant incidents. The formatted database of quantitative damage ratings can be searched and assessed for trends and correlations with geotechnical conditions. The software CIGT developed by El Teniente is an example of such a database, as shown in the figure below. | Detailed damage observations are made regularly, sometimes using electronic tablets, in addition to significant incidents. The formatted database of quantitative damage ratings can be searched and assessed for trends and correlations with geotechnical conditions. The software CIGT developed by El Teniente is an example of such a database, as shown in the figure below. | ||
[[File:Figure 11.png]] | [[File:Figure 11.png|link=]] | ||
Figure: Example of CIGT rock mass and support damage software | Figure: Example of CIGT rock mass and support damage software | ||
Deformation readings from instrumentation are well tracked over time to monitor the response to mining. Readings are stored and organised to facilitate analysis of the link between seismicity and deformation. Laser scanning ( | Deformation readings from instrumentation are well tracked over time to monitor the response to mining. Readings are stored and organised to facilitate analysis of the link between seismicity and deformation. Laser scanning (LiDAR) has been introduced at a number of operations to quantify surface deformation over time. | ||
Laser scanning has much better spatial coverage than single borehole instruments. Baseline laser scans are kept of all active development areas and scans are redone regularly, or after large seismic events. An example of laser scanning results is shown in the figure below. Displacement is measured relative to a previous baseline scan. | Laser scanning has much better spatial coverage than single borehole instruments. Baseline laser scans are kept of all active development areas and scans are redone regularly, or after large seismic events. An example of laser scanning results is shown in the figure below. Displacement is measured relative to a previous baseline scan. | ||
[[File:Figure 12.png]] | [[File:Figure 12.png|link=]] | ||
Figure: Laser scan cloud comparison, floor heave at intersection | Figure: Laser scan cloud comparison, floor heave at intersection (Hancock 2018) | ||
== 3.4 Ground support capacity == | == 3.4 Ground support capacity == | ||
=== 3.4.1 | === 3.4.1 Standard === | ||
Planned ground support is generally documented for all development areas although the actual installed support is not confirmed, or the original planned support standard may not be readily available for all areas. | Planned ground support is generally documented for all development areas although the actual installed support is not confirmed, or the original planned support standard may not be readily available for all areas. | ||
| Line 132: | Line 135: | ||
=== 3.4.2 Advanced === | === 3.4.2 Advanced === | ||
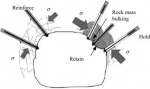
Planned and installed support is documented in a database at operations with advanced ground support data practices. This includes the location and date of installation, as well as all the support details. Secondary support installation and rehabilitation is also tracked. The capacity of support elements is tested onsite under local installation for QA/QC purpose, and ground conditions to understand in | Planned and installed support is documented in a database at operations with advanced ground support data practices. This includes the location and date of installation, as well as all the support details. Secondary support installation and rehabilitation is also tracked. The capacity of support elements is tested onsite under local installation for QA/QC purpose, and ground conditions to understand in situ behaviour. This may include static pull testing and in situ drop testing (as shown in figure below table) to determine the dynamic capacity in specific ground conditions. | ||
Support damage classification schemes in the table below are useful and provide a more systematic and comparable scale of support damage, which can contribute in the assessment of the residual capacity and the need for rehabilitation. | Support damage classification schemes in the table below are useful and provide a more systematic and comparable scale of support damage, which can contribute in the assessment of the residual capacity and the need for rehabilitation. | ||
| Line 138: | Line 141: | ||
{| class="wikitable" | {| class="wikitable" | ||
|- | |- | ||
|Damage Level | |'''Damage Level''' | ||
|General Description | |'''General Description''' | ||
|Support Damage | |'''Support Damage''' | ||
|Shotcrete Damage | |'''Shotcrete Damage''' | ||
|- | |- | ||
|S0 | |S0 | ||
| Line 196: | Line 199: | ||
Table: Support damage classification scale (Heal 2010) | Table: Support damage classification scale (Heal 2010) | ||
[[File:Figure 13.png]] | [[File:Figure 13.png|link=]] | ||
Figure: In | Figure: In situ testing of rock reinforcementy a) quasi static pull test (photo courtesy of Atlas Copco); b) drop testing rig to assess dynamic ground support capacity in specific ground conditions (Carlton et al. 2013) | ||
Latest revision as of 14:17, 8 June 2020
| Standard Practices | Advanced Properties | |
| 3.1 Rock Properties
|
||
| 3.2 Stress Properties
|
||
| 3.3 Deformation/Damage Monitoring
(Kaiser 1996) |
||
| 3.4 Ground Support Capacity
(Cai and Kaiser 2018) |
Every operation collects a wide range of different types of geotechnical data. Sites with better practices are continuously reviewing the data quality to ensure the analysis and design assumptions are valid. Better geotechnical data systems are also very well organised and can be easily analysed in a variety of software packages. Four geotechnical data categories are considered; rock properties, stress properties, deformation/damage monitoring and ground support capacity.
3.1 Rock properties
3.1.1 Standard
Standard geomechanical properties of intact rock (Uniaxial Compressive Strength (UCS), density (ρ), Young’s modulus (E), Poisson’s ratio (ν)) are generally defined for each geotechnical rock type. Field measurements such as point load tests are often used to supplement laboratory testing. Rock testing is often done during feasibility studies, but additional testing is not conducted regularly during production.
Core logging is normally done using various rock mass classification systems. Borehole mapping using televiewer and underground mapping is often used to supplement core logging data, as shown in the below figure. Rock mass classification systems are generally used to quantify the reduction in strength between the intact rock and the rock mass. The rock mass properties, as an equivalent continuum, are generally used in mine scale numerical modelling assessments. Rock mass quality block models are normally done with the geological modelling software used on site. This sometimes means the format is difficult to export into seismic analysis software which inhibits the assessment of the variation in seismic hazard as a function of rock mass quality.
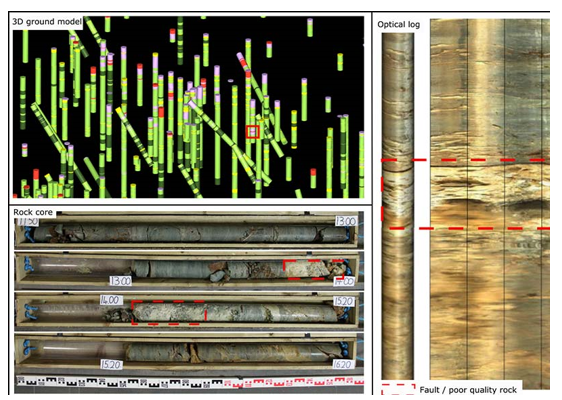
Figure: Geotechnical logging of drill core (Institution of Civil Engineers)
3.1.2 Advanced
Operations with advanced rock property databases continue to use field and lab testing throughout production to confirm the assumptions in the feasibility study, and to characterise the rock properties in proximity of the current mining areas. There are enough test results to get a good distribution of parameters to understand the variation between samples. It is critical that the orientation of testing is recorded; either the absolute orientation of the sample, or the direction of testing relative to the bedding or foliation direction.
Indirect tensile tests, joint shear tests, toughness and seismic velocity tests are conducted along with the UCS test. Triaxial testing is done to define the stress dependent strength component.
Advanced rock mass classification models have a dense array of data points. They might be produced in alternate software, but are available in seismic analysis software to assess the seismic hazard with respect to rock mass quality.
3.2 Stress properties
3.2.1 Standard
Pre-mining stresses are assessed during the feasibility or early operating stages of most projects. In mining, the most common stress measurement techniques include overcoring using the Hollow Inclusion (HI) cell, or by core testing under uniaxial load in the laboratory using acoustic emission (AE) activity and deformation rate analysis (DRA). These approaches can be used to estimate the full in situ stress field.
Feasibility estimates for the relation between principal stresses and depth are often dependent on a very limited number of samples and additional testing is not done regularly during the operation, even when the mining has progressed well outside the initial testing area. In particular, with regard to the orientation of principal stresses, minor errors can have a major influence on the expected stresses around excavations especially as stress fields can change over short distances by faults and contrasting geotechnical properties of the rock.
The stress conditions during mining are often only inferred from damage monitored by visual inspection and field notes.
3.2.2 Advanced
Operations with advanced practices in collecting stress data have a much larger database of test results to better understand the spatial variability and uncertainty of the pre-mining stress field. Stress measurements are taken regularly throughout production, ensuring different depths and areas are assessed.
Some operations also employ real-time stress monitoring in selected areas such as regional pillars, critical infrastructure and cave footprints. Monitoring boreholes are also used to assess stress conditions over time. Borehole cameras are used to monitor the signs of high stress conditions along the borehole as mining progresses, as shown in the figure below. Large rock mass deformation, plate bending and rock mass deterioration are all signs of high stress conditions in a drive. Regular field observations are recorded to infer the stress level at the surface of new developments. Acoustic televiewers are used to interpret the local stress from breakouts.
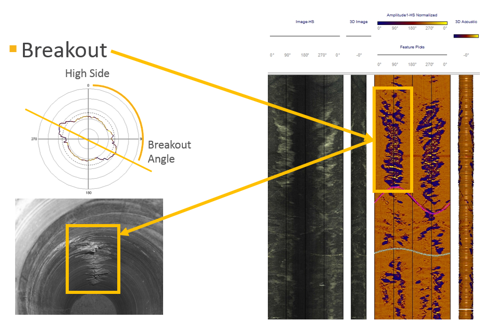
Figure: Borehole breakout can be monitored with borehole camera and acoustic televiewer logging (Goodfellow et al. 2017)
3.3 Deformation/damage monitoring
3.3.1 Standard
Rock mass deformation is normally monitored during regular inspections, but often the observations are only sparsely documented and not collated into a searchable format. Incidents of damage are generally reported individually and there is no easily accessible database to facilitate long term analysis of damage trends across many incidents.
Instrumentation is often used to supplement observational data. Borehole extensometers are used to monitor differential displacement beyond the excavation surface. They are often installed in targeted areas with excessively large spans and key infrastructure. Crack monitors are another common instrument to monitor the ongoing movement across observed cracks.
3.3.2 Advanced
Operations that have better deformation and damage data keep detailed records of the fracturing and deformation at the surface of all excavations. These records are stored in a single formatted database including the Date-Time and 3D-coordinates. Mines with fibre-reinforced shotcrete (FRS) have a similar system, except they use an FRS damage scale to quantify the deformation.
Detailed damage observations are made regularly, sometimes using electronic tablets, in addition to significant incidents. The formatted database of quantitative damage ratings can be searched and assessed for trends and correlations with geotechnical conditions. The software CIGT developed by El Teniente is an example of such a database, as shown in the figure below.
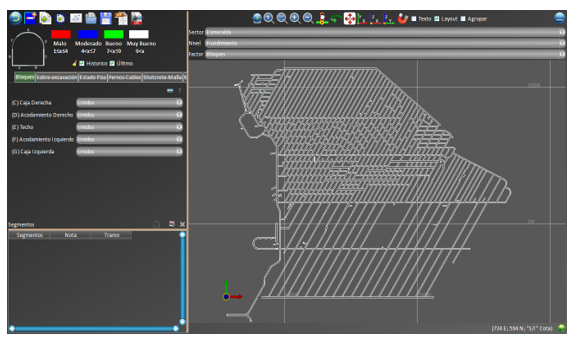
Figure: Example of CIGT rock mass and support damage software
Deformation readings from instrumentation are well tracked over time to monitor the response to mining. Readings are stored and organised to facilitate analysis of the link between seismicity and deformation. Laser scanning (LiDAR) has been introduced at a number of operations to quantify surface deformation over time.
Laser scanning has much better spatial coverage than single borehole instruments. Baseline laser scans are kept of all active development areas and scans are redone regularly, or after large seismic events. An example of laser scanning results is shown in the figure below. Displacement is measured relative to a previous baseline scan.
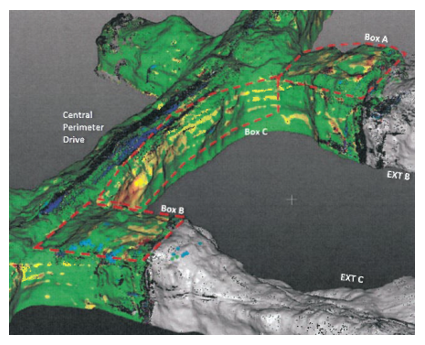
Figure: Laser scan cloud comparison, floor heave at intersection (Hancock 2018)
3.4 Ground support capacity
3.4.1 Standard
Planned ground support is generally documented for all development areas although the actual installed support is not confirmed, or the original planned support standard may not be readily available for all areas.
The changes to support conditions over time are generally monitored by inspection. Observations may be sparsely documented and are usually qualitative in nature and not organised and formatted in a regular manner. Estimating the residual support capacity over time is difficult given frequent mine equipment-related damage, corrosion and other signs of loading.
The capacity of individual ground support elements is often estimated using generic parameters from supplier testing and lab tests and not confirmed with site installation and ground conditions.
3.4.2 Advanced
Planned and installed support is documented in a database at operations with advanced ground support data practices. This includes the location and date of installation, as well as all the support details. Secondary support installation and rehabilitation is also tracked. The capacity of support elements is tested onsite under local installation for QA/QC purpose, and ground conditions to understand in situ behaviour. This may include static pull testing and in situ drop testing (as shown in figure below table) to determine the dynamic capacity in specific ground conditions.
Support damage classification schemes in the table below are useful and provide a more systematic and comparable scale of support damage, which can contribute in the assessment of the residual capacity and the need for rehabilitation.
| Damage Level | General Description | Support Damage | Shotcrete Damage |
| S0 |
|
|
|
| S1 |
|
|
|
| S2 |
|
|
|
| S3 |
|
|
|
| S4 |
|
|
|
| S5 |
|
|
|
Table: Support damage classification scale (Heal 2010)
Figure: In situ testing of rock reinforcementy a) quasi static pull test (photo courtesy of Atlas Copco); b) drop testing rig to assess dynamic ground support capacity in specific ground conditions (Carlton et al. 2013)